
21. What do you know about the rattle package in R?
Rattle is a popular GUI for data mining using R. It presents statistical and visual summaries of data, transforms data so that it can be readily modelled, builds both unsupervised and supervised machine learning models from the data, presents the performance of models graphically, and scores new datasets for deployment into production. A key features is that all of your interactions through the graphical user interface are captured as an R script that can be readily executed in R independently of the Rattle interface.
22. How would you make multiple plots onto a single page in R?
Plotting multiple plots onto a single page using base graphs is quite easy:
For, example if you want to plot 4 graphs onto the same pane, you can use the below command:
par(mfrow=c(2,2))

23. How would you create a scatterplot using ggplot2 package?
A scatter-plot can be used to visualize the correlation between two or more entities at the same time.
Let’s take an example and understand how to make a scatter-plot using ggplot2 package->
ggplot(iris,aes(y=Sepal.Length,x=Petal.Length))+geom_point()
24. How would you facet the data using ggplot2 package?
Let’s take an example to understand faceting with ggplot2
Initial:
ggplot(house,aes(y=price,x=waterfront))+geom_boxplot()
ggplot(house,aes(y=price,x=waterfront))+geom_boxplot()+facet_grid(.~waterfront)

25. Given a vector of values, how would you convert it into a time series object?
Let’s say this is our vector->
a<-c(1,2,3,4,5,6,7,8,9)
To convert this into a time series object->
as.ts(a)->a
Let’s plot this:
ts.plot(a)
26. What is a White Noise model and how can you simulate it using R?
The white noise (WN) model is a basic time series model.It is the simplest example of a stationary process.
A white noise model has:
- A fixed constant mean
- A fixed constant variance
- No correlation over time
Simulating a white noise model in R:
arima.sim(model=list(order=c(0,0,0)),n=50)->wn

ts.plot(wn)

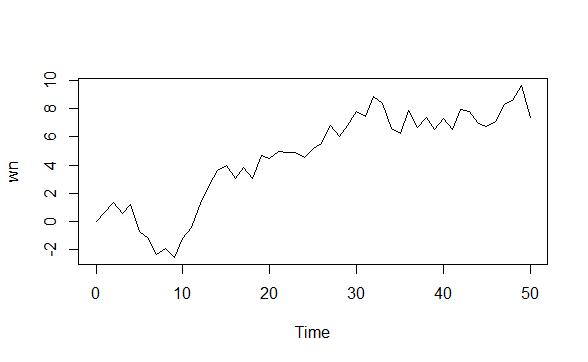
27. What is a Random Walk model and how can you simulate it using R?
A random walk is a simple example of non-stationary process.
A random walk has:
- No specified mean or variance
- Strong dependence over time
- It’s changes or increments are white noise
Simulating random walk in R:
arima.sim(model=list(order=c(0,1,0)),n=50)->rwts.plot(rw)
28. What is Principal Component Analysis and how can you create a PCA model in R?
Principal Component Analysis is a method for dimensionality reduction. Many a times, it happens that, one observation is related to multiple dimensions(features) and this brings in a lot of chaos to the data, that is why it is important to reduce the number of dimensions.
The concept of Principal Component Analysis is this:
- The data is transformed to a new space, with equal or less number of dimensions. These dimensions(features) are known as principal components.
- The first principal component captures the maximum amount of variance from the features in the original data.
- The second principal component is orthogonal to the first and captures the maximum amount of variability left.
- The same is true for each principal component, they are all uncorrelated and each is less important than the previous one.
We can do PCA in R with the help of “prcomp()” function.
prcomp(iris[-5])->pca
Let’s see how thee variability decreases across different principal components
screeplot(pca)
29. How would you find out the mean of one column w.r.t another?
Let’s perform the operation on the iris data-set:

We’ll be using the mean() function from the mosaic package
mean(iris$Sepal.Length~iris$Species)
This command gives the mean values of Sepal-Length across different species of iris flower.
We observe that “virginica” has the highest sepal length and “setosa” has the lowest sepal length.
30. Explain about “initialize()” function in R?
initialize() function is used to initialize the private data members while declaring the object.
With the above code, we are initializing the values of “name” and “cost” during the time of declaration
We have initialized the values of ‘500’ to cost and ‘pizza’ to name
